

ESP IoT Development Framework (ESP-IDF) in Visual Studio Code
Learn how to use ESP IoT Development Framework with Visual Studio Code, together with ESP-IDF VSCode Extension. Setup, build, flash and monitor your application
We have already compared the two most popular development frameworks for ESP32 and ESP8266 boards. If you picked ESP-IDF, Espressif's own Visual Studio Code extension is the most complete way to use it - free, actively maintained, and it wraps the whole build-flash-monitor-debug workflow behind the VS Code Command Palette.
Coming from the Arduino IDE? See the comparison between Visual Studio Code and Arduino IDE first - in short, we prefer VS Code once a project outgrows a single sketch file, mostly for the editor and debugging tools.
1Getting the development stack ready
To develop with ESP-IDF in Visual Studio Code you need the editor itself, a couple of build prerequisites, and Espressif's extension. Then it's one more command to pull down ESP-IDF and its toolchain.
- Download and install Visual Studio Code. It runs on Windows, macOS and Linux; platform-specific install steps are here.
- Install the ESP-IDF build prerequisites for your OS.
- Open VS Code, select the Extensions icon in the left sidebar (
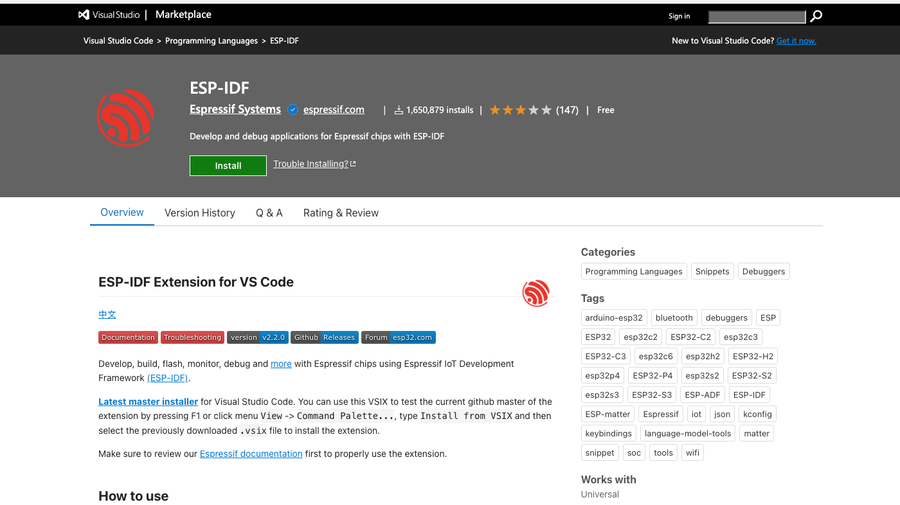
Shift+Cmd+Xon Mac), search for ESP-IDF, and install the official extension published by Espressif Systems.
Windows
No additional prerequisites - the Installation Manager in the next step installs everything ESP-IDF needs.
macOS and Linux
Install the OS packages ESP-IDF's build system needs before continuing - see Espressif's Linux and macOS prerequisites guide. Full OS-by-OS detail is also in the extension's own README.
2Configure the extension
With the extension installed, open the Command Palette (View -> Command Palette, or Shift+Cmd+P on Mac) and run ESP-IDF: Open ESP-IDF Installation Manager. This downloads the ESP-IDF framework itself, its toolchain, and sets up a Python virtual environment for it - pick the ESP-IDF version you want to install and let it run.
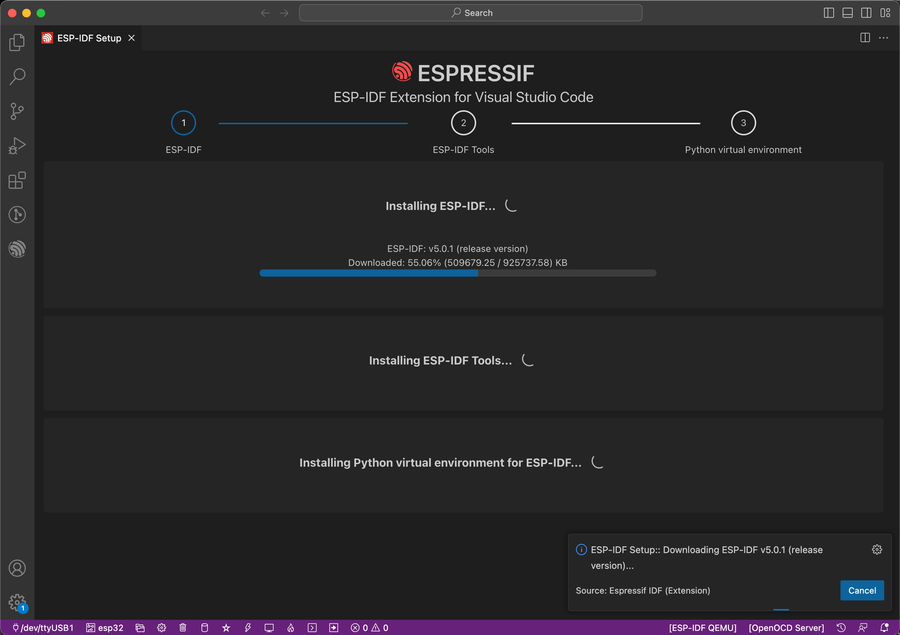
When it finishes, you will see a confirmation that setup is complete and you can start using the extension. The Installation Manager is also available as a standalone download if you would rather run it outside VS Code first. Full walkthrough: official ESP-IDF VS Code extension install guide.
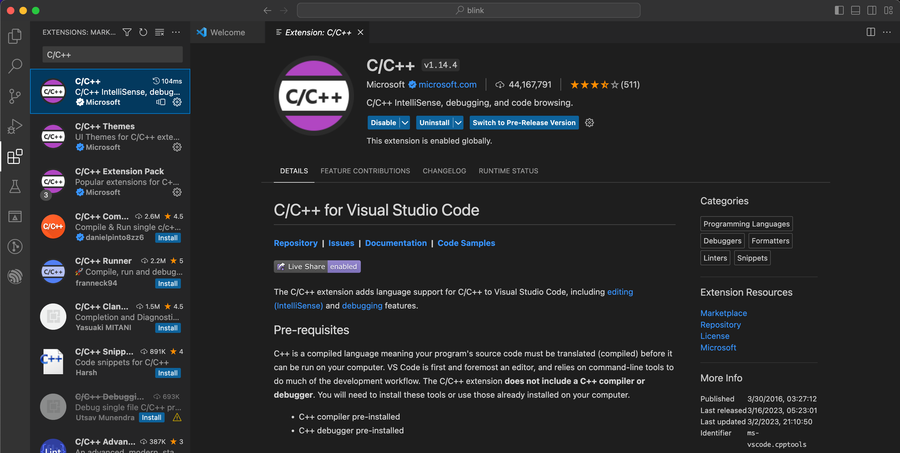
Recommended: install the C/C++ extension too. For proper syntax highlighting, code navigation and suggestions, install Microsoft's C/C++ extension the same way - search "C/C++" in the Extensions view and restart VS Code after installing. ESP-IDF projects already ship a working .vscode/c_cpp_properties.json, so it should work without extra setup.
3Building and flashing the blink example
With the extension configured, let's create, build and flash the "blink" example so you can confirm the whole toolchain works end to end.
- Open the Command Palette and run ESP-IDF: New Project. Choose ESP-IDF as the framework, then find blink under the "get-started" examples. Click Create project using example blink, pick a folder on your computer, and the extension opens the new project in VS Code.
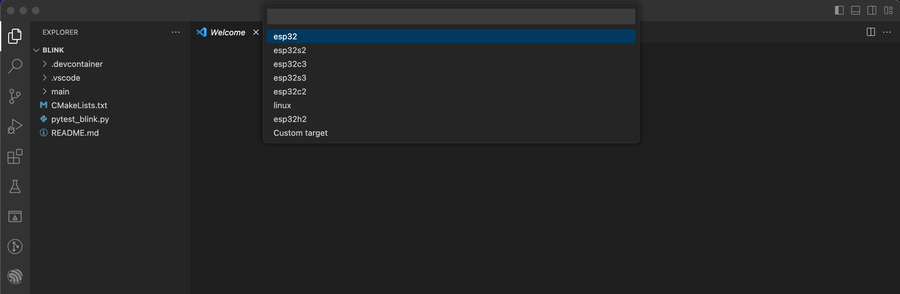
- Set your target chip: run ESP-IDF: Set Espressif Device Target and pick your chip from the list -
esp32,esp32s2,esp32c3(used on boards like the XIAO ESP32-C3),esp32s3, and others. If you skip this step, the target defaults toesp32. - Select your USB port: run ESP-IDF: Select Port to Use (COM, tty, usbserial) and choose the port your board is connected to. Not sure which one it is? Unplug the board, repeat the command, and see which port disappeared from the list.
- Build the project: run ESP-IDF: Build Your Project. This opens a terminal and starts the build - a successful build ends with a summary of program sizes.
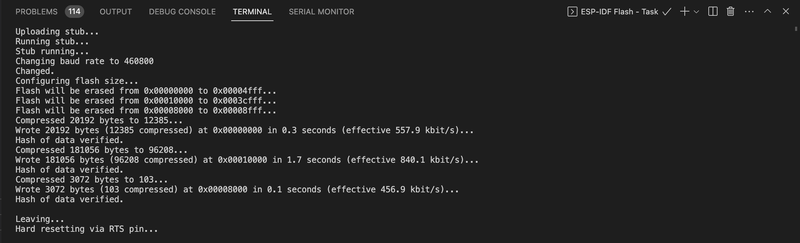
- Flash it: run ESP-IDF: Flash Your Project. The default flashes over UART; you'll see upload progress in the terminal, ending with a hash-verified confirmation.
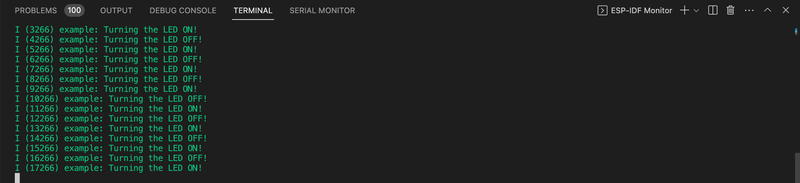
- Watch and listen: the board's built-in LED should start blinking. Run ESP-IDF: Monitor Device to see the matching log output in a terminal.
One command for all three. Once your target and port are set, you can skip running build, flash and monitor separately - ESP-IDF: Build, Flash and Start a Monitor on Your Device runs all three in sequence from a single Command Palette entry.
If you plan to debug over JTAG later, you will also run into an OpenOCD board-configuration picker (reached via ESP-IDF: Select OpenOCD Board Configuration) that lists the debug adapters for your chip. It is unrelated to basic UART flashing above and only matters once you start debugging.

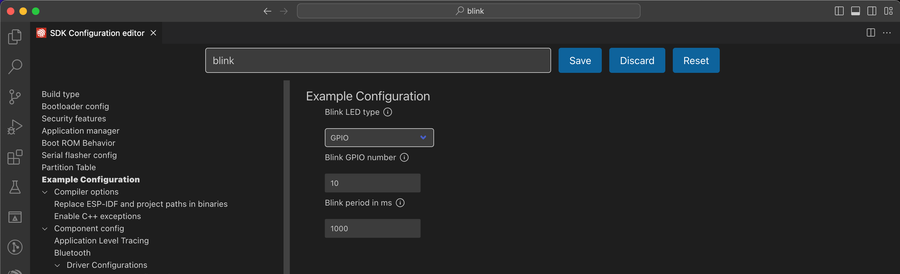
Built-in LED not blinking? Make sure the example is configured for your board. Run ESP-IDF: SDK Configuration Editor (Menuconfig), search for "blink" in the search bar (or open Example Configuration from the left menu), and check two things:
- Under Blink LED type, pick RMT - Addressable LED if your board has an addressable built-in LED, otherwise GPIO.
- Under Blink GPIO number, set the pin that matches your board's built-in LED (or any GPIO, if you wired up your own LED).
More detail on daily use of the extension: official ESP-IDF VS Code extension project guide.
Additional tools provided by ESP-IDF
Size analysis
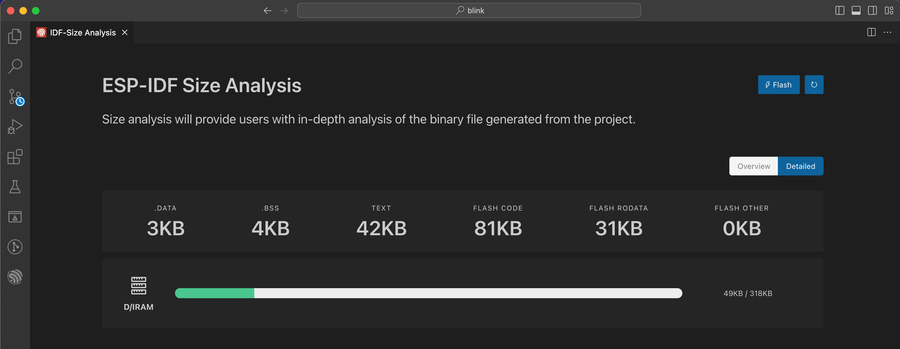
After a build, run ESP-IDF: Size Analysis of the Binaries to see how much flash and RAM your application uses - handy for keeping an eye on how close you are to a microcontroller's limits.
ESP-IDF Explorer
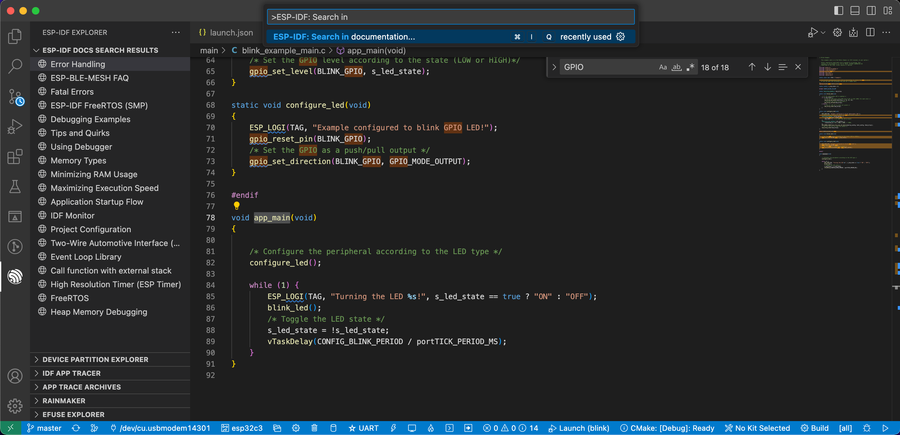
The Espressif icon in the Activity Bar opens the ESP-IDF Explorer: device partitions, app trace, RainMaker, eFuse, and documentation search results all live here.
Docs search
Select any part of your code, then run ESP-IDF: Search in Documentation.... Matches show up under "ESP-IDF Docs Search Results" in the Explorer and link straight to the relevant page.
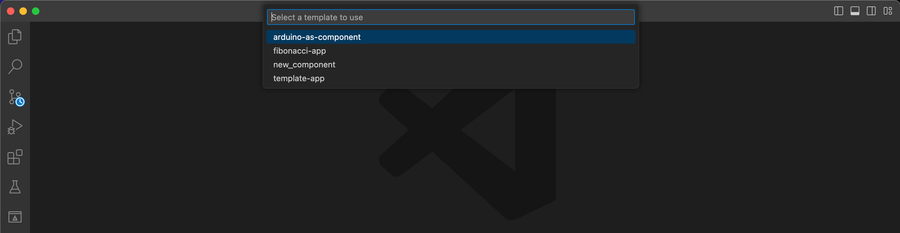
The same ESP-IDF: New Project wizard you used to create the blink example also offers templates from other frameworks configured in the extension - for example, "arduino-as-component" gives you a project where you can write Arduino Core code inside an ESP-IDF application.
ESP-IDF Visual Studio Code cheat sheet
We have covered several commands in this guide - here they are together, using the current command names, to keep bookmarked. Open the Command Palette with View -> Command Palette or the shortcut Shift+Cmd+P on macOS (check your OS's shortcut next to "Command Palette" in the View menu), then type the command name. Frequently used commands also show a keyboard shortcut next to them in the palette.
Build, flash and monitor
ESP-IDF: Build, Flash and Start a Monitor on Your Device- run all three steps in sequenceESP-IDF: Build Your ProjectESP-IDF: Flash Your ProjectESP-IDF: Monitor Device
Creating projects
ESP-IDF: New Project- create a project from an ESP-IDF example or an extension template
Configuration
ESP-IDF: Set Espressif Device TargetESP-IDF: Select Port to Use (COM, tty, usbserial)ESP-IDF: SDK Configuration Editor (Menuconfig)ESP-IDF: Select Flash Method- choose UART, DFU or JTAGESP-IDF: Open ESP-IDF Installation Manager- only needed for initial setup, or to add/change an ESP-IDF version
Other useful commands
ESP-IDF: Size Analysis of the BinariesESP-IDF: Search in Documentation...ESP-IDF: Doctor Command- prints a diagnostic report, useful when asking for help
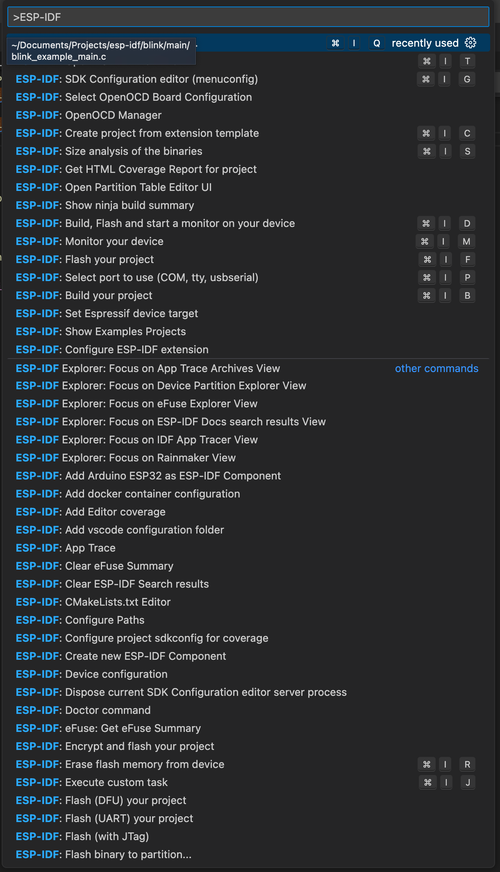
There are several more commands provided by the ESP-IDF VS Code extension - the ones above cover the basics of building, flashing and monitoring ESP32 microcontrollers.